• RSS
  • Facebook
  • Twitter
  • Linkedin

Sunday, 20 October 2013

The Secret Language Of Market


We Cannot Understand the Stock Market ,if we do not first learn the language and Grasp the Symbol in which it is written -Market is Written in Mathematical Language and its  Symbols  are   Geometrical Patterns - Without this it is Impossible to Comprehend a single word of it and the persons who gains this understanding and wisdom  is more Profitable - This Harmony is expressed by some key Fibonacci Numbers - Each Individual Stock or Commodity Have its Harmony Numbers - Which you will Discover If you Study the Patterns and charts of last 10 -15 years


Watch Marko Rodins Video on Youtube and just try to understand what he is saying .Basically he is found the Math to the real 'God Particle or Particle of Spirit - Known as Brahman in the vedas ,and he has shown -how it can be observed - but not with the Physical Instruments .Thus Mathematics is in fact Surest proof of cosmic mind and Intelligence - If Mathematics is the language of the Market and the Nature - & rather acting on common sense opinion and emotional decision where most Trader get Screwed - That's what happens in the Stock market -Traders make their Decision On Emotion Rather base on  Pure Mathematical Approach   


Ed Seykota the all time great Trend Following Trader Declared that the biggest Secret about success in trading is that there is not any big Secret about it - The more complicated and sophisticated   inidicators you develop it will became more harder to follow it and make money from that indicator -The most Robust Strategies in the Markets are the Simplest Strategies - Which are Base on Simple Mathematics - So in Short Complicated Trading Systems Cant be Profitable in the Long Run - So develop a trading Plan which is More Compatible with your own Nature of trading -because we understand ourselves more better then any other person - So build System According to your Nature and Behavior  and once you Develop the Trading System - Then the Key to Long term Survival and Prosperity has a lot to do with the money management techniques which should be incorporated into Your Trading System 


Saturday, 12 October 2013

What is a Gann Emblem ?

What is a Gann Emblem ?

Gann Emblem is basically a Forecasting Tool Which Forecast the Future Reversal dates .Gann Said Within a Circle is a square and a Triangle and this aspects are related to Astrology , Where we take Solar Degrees Into Consideration - But as in astrology Specific Zodiac Signs Are Related to individual person ( What we Called the Ruling Planet of the Individual ) - same laws Apply in stock market - For each Specific Stock ,Index or Commodity  they have their Individual Ruling Planet and Zodiac Signs


How do we find our Ruling Planet and Zodiac Signs ?

Base on Our time of Birth and than Longitude and  Latitude same things Apply for Stocks , Index For Example NIfty Was Born on Monday 7 Nov 1994   if i am not wrong ,Whereas
To find Out the Longitude and Latitude we have to take NSE location into consideration
So by taking this things into account we can Find the Ruling Planet and Zodiac Sign Of Nifty
And If u notice the All time High in Nifty Spot was made on 5 November 2010 and it was Friday - So the cycle has completed 2 Days Before - Because 7 Nov was a Sunday .

To Use Gann Emblem Forecasting Technique to its Potential  it is  Mandatory To Know The Financial Astrology  - Which is a whole new Topic in Itself -  and it will take Years to Master .So Just i have Given a Glimpse of What is Gann Emblem Basically .

Sunday, 29 September 2013

One of the Software that i use to Draw the Gann Angles is Gannlyst - i have also given the link to download this software in the Download section - i feel Ganalyst is the only software which has the Capability to Draw gann Angles in a more Precise way


In  drawing Gann Angles Scaling of the Angle is most important part of drawing Geometric angle - once we understand this it will become more effective

Scaling is nothing but Vibration of the particular Stock  or commodity - As W.D.Gann have Mention that Price and Time are the Same thing - Thus we have to scale the price in Direct correlation toTime


Let See The Types of Gann Angles


W.D.Gann Have Discover nine Different important angles -With 1*1 is the most Important Angle


1*8 = 82.5Degree

1*4 =  75  Degree
1*3 = 71.25 Degree
1*2 =63.75 Degree
1*1 =45 Degree
2*1= 26.25 Degree
3*1= 18.75 Degree
4*1= 15 Degree
8*1= 7.5 Degree

Now let See How to Measure The Scale of a Particular Stock or Index


Method 1)


For Up Trend


( Main Bottom 2 - Main Bottom 1 ) / Time Difference Between (Bottom 2 and Bottom 1 )


For Down Trend


(Main Top 1 - Main Top 2 )  / Time Difference Between (Bottom 2 and Bottom 1 )


Note - Here the Time Difference We can Take Either Trading Days Or Calender Days - By Plotting both the time frames we will come to Know which one will workout more better out of two - and thus we can use that time difference in our further Analysis


Method 2) 


Here we simply Take the Main Top or bottom Which has Formed Recently and Take the Square root of it for 2 time and insert that number in the Price Scale


For Example The


The All time High of Nifty is 6349


√6349
√79.68


  8.93 = Scale Factor for that particular High - is 8.93 

To illustrate i have given you in a Graphically Form by taking the Low of 10 April 2013 Low that is 5477


                                                          Click On the Image To Enlarge


Thursday, 5 September 2013


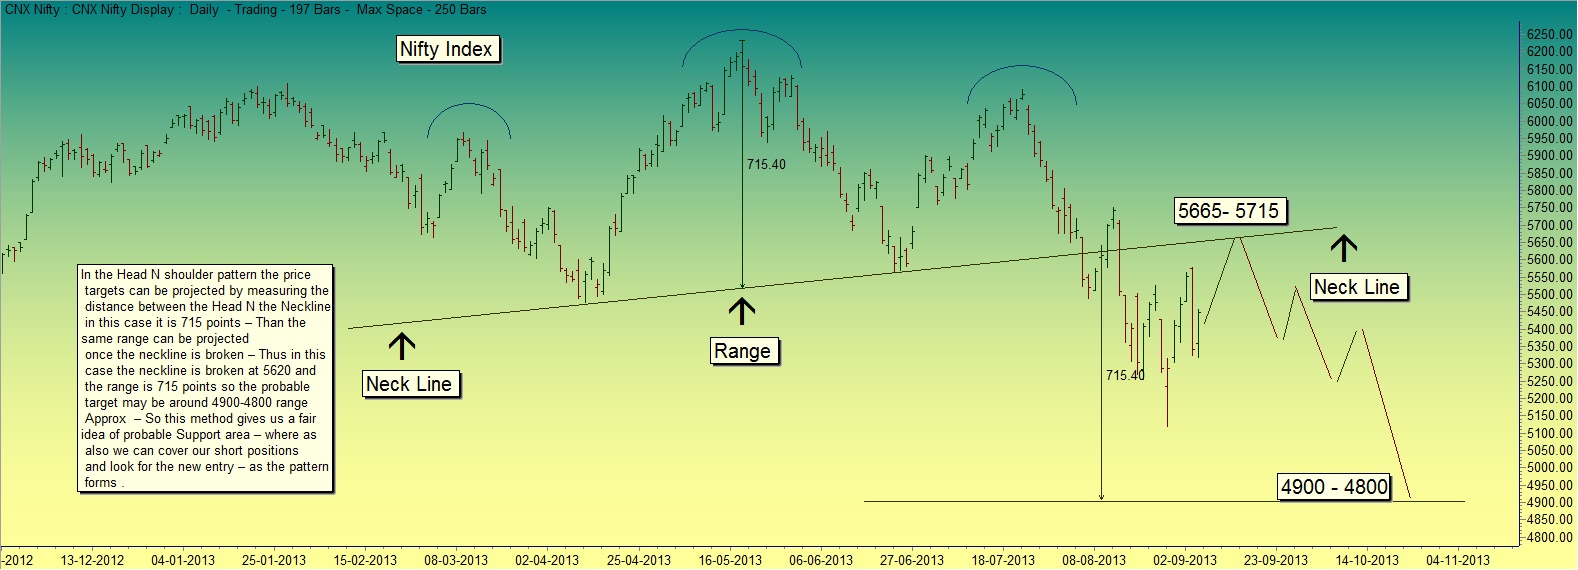
In the Head N shoulder pattern the price targets can be projected by measuring the distance between the Head N the Neckline in this case it is 715 points – Than the same range can be projected once the neckline is broken – Thus in this case the neckline is broken at 5620 and the range is 715 points so the probable target may be around 4900-4800 range Approx  – So this method gives us a fair idea of probable Support area – where as also we can cover our short positions and look for the new entry – as the pattern forms .


                            Click on the Image to enlarge 


When a possible Head N shoulder pattern is setting up 
You can measure the left hand side (Shoulder) Top to (Head) Top -The time or trading days it has taken to form -   and than the right hand side Shoulder 
Top we can predict with same approximation 

Where as in this case it has turned out excatly the same amount of trading days which is 46 days 


Again we can confirm that trade and initiate short   with some indicator or simple trend line break 


      Click on the Image to Enlarge - to get a better view 


Sunday, 28 July 2013


And will bring out   and Test Your Weakest Emotions (Financially and Psychologically ) So that is the reason  we should have a good trading system and Money management rules for decision making . To develop a trading system You should study the charts over a period of at least 20 to 30 years of that particular Stock or commodity that will give you the confidence to act and make profits when you can see and   know for yourself why stocks should go Up or down – If you do this you will prepare yourself to act independently without anyone’s advice – because you will know from your study where the market is headed and thus you will act with confidence and not with the GUESS Work


Money Management is one of the most important aspects of
any trading system and the First defense from loss –And of any Trading system the main weapon to protect you from Disaster losses is STOP LOSS and placing a stop is an art – and explaining it is beyond the scope this article  - For Money Management You should Develop trading system which is tested  at least on  20 years of chart – If you don’t have any trading system or Money management that means you are weak in both the areas and will never have confidence in your Entry price , Exit Price cause you don’t have a plan to execute and thus you will act on your Human emotions (So that is the reason Trading is against the human nature and the Market is design to teach you to fail ) So its very crucial to have money management and trading plan into place Cause it will Remove the Subjectivity of the human condition  .

At last- If your not Ready to dedicate your time and energy in studying the Historical charts - then please don’t trade with your Impulsive emotions and Guess Work .


Have a safe Trading with ( logical Stop Loss) .


Sunday, 23 June 2013

Matt Olsen (Gann Method )


I would like to share one very effective method which will help us in taking Positional and Intraday trade - but i prefer we should use it in a positional trade  to avoid less Whipsaw - the method will help us to scale the chart graphically in a more precise way and also help  us to use the trend line in a more accurate way 


The Method is Base on W.D.Gann and further developed by Matt Olsen (Thanks to both of them )

To use this method you should have a Square tool option in your software - I personally use Gannalyst software and it has that tool and i have also given a download link of this software  in my blog  

This Method takes into consideration the Previous swing major high and low points ( not the near ones but little extremes ones so that we can form a square 


First we should select the high and low points in such a way that it should form a square or rectangle 


once we plot the high and low in a chart we will get a square or we may het rectangle according to high and low formation 


Now from the left hand side (bottom) corner  of the square or rectangle draw a diagonal line which will intersect at right hand side (TOP) corner 


Now do the same thing from the left hand side (TOP) corner of the square or rectangle draw a diagonal line which will intersect at right side (bottom) corner 


The geometrical shape will give us two diagonal lines 

1) One upward trending Diagonal line and
2) Second Downward trending Diagonal line 


Once we get this diagonal lines we have to use the option in our software duplicate or copy so that we can get the same degrees of diagonal lines which we can use in the further swings 

For up trending swing use the up trending diagonal by placing the diagonal on the low of the chart once the low is formed (With Stop Loss)


And for down trending swing use the down trending diagonal by placing the diagonal on the high of the chart once  the high is formed (With Stop Loss)


When this diagonal are place we should see how the price behave to this diagonals and take position once the price crosses the diagonals on closing basis with stop loss 


This Method works very fine because its finds the natural harmonic and DNA of the the swing by taking past swing into consideration 


If we  Apply this Method on a daily or Weekly Chart we will get very good Tradable swings 


Please apply this method and let me know whether we can make any more improvements in this method 


Thank You