


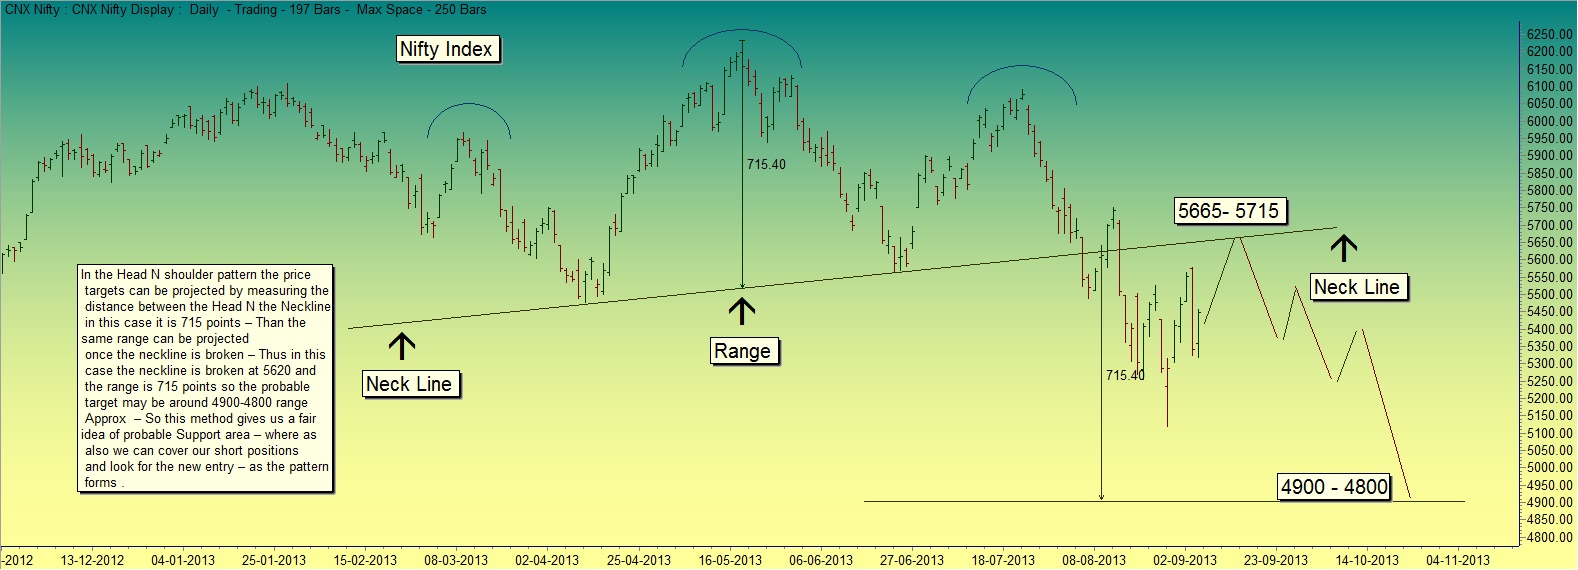
In the Head N shoulder pattern the price targets can be
projected by measuring the distance between the Head N the Neckline in this
case it is 715 points – Than the same range can be projected once the neckline
is broken – Thus in this case the neckline is broken at 5620 and the range is
715 points so the probable target may be around 4900-4800 range Approx – So this method gives us a fair idea of
probable Support area – where as also we can cover our short positions and look
for the new entry – as the pattern forms .
Click on the Image to enlarge


if the HnS pattern plays out in the near term after taking resistance in the in the 5665-5715 indicated zone,then we have bearish market scenario for the next 2-3 months with the occassional pullbacks.have u noticed NIFTY has bounced back from the 1x1 Gann angle near 5100 level and giving good bounce.According to GANN,if a market is above 1x1 Gann angle ,then it is BUlL and below it BEAR.Also big HnS targets are seldom fulfilled and markets move in the reverse direction with ferocity.Pls guide me and all the readers how to download data in Gannalyst software.
ReplyDeleteThis comment has been removed by the author.
ReplyDeleteEquity Trading Tips
ReplyDeleteThe links and resources posted by you in the blog are very useful for me