• RSS
  • Facebook
  • Twitter
  • Linkedin

Sunday 28 September 2014

If you don't want Stress in  Your Trading then learn How to manage your Trade - Now most of the traders know how to enter in the market (with their own wish - But don't know how to exit - how to manage the trade once we are into the trade -how to handle the chaos )  either we enter with our 


  • Trading System Rules 
  • Due to our Excitement level to do something 
  • On news base 
  • Tips Provider 
  • Gut feeling 
  • Random Entry Etc 


 We can enter in the market with our own  wish - and  once we are enter the real game starts -if the trade goes against us most of us don't know how to handle the Chaos - Say for example this market is like a Riots what we call  DANGAL a civil disorder by a group of people - In Riots our first Priority is to Protect our selves with the Damages and to be safe at our place - This Market is also same once the Market is open the Dangal (Riots)  Starts  and we are enter into this place - and once we are enter the unexpected things starts to happen -and we are trap in human emotions and our thinking may get paralyzed  Now here your Skill comes into play -how you handle this Chaos Skillfully and be safe -  When the trade starts to go against us we become Emotionally Unresponsive - we keep on hoping that the Stock will come again to break even - and we keep on damaging our Account with this attitude 

Detachment and  Be a Observer is the key - For better Decision Making 

Say for Example on the Street you are going and a accident takes places of a vehicle and you are the witness of that Incident (A observer) - Now those two people who met with the accident can be able to give correct justification of who's fault is it ?

Answer is No 

Cause their Ego and attachment comes in their way 

Then who can Give it ?
Its You 
Cause you are the Observer without any  attachment towards both of them and you can easily recognize  who;s  fault it is 

Same Approach we should  maintain in trading - just be a observer of the things and you will instantly recognize you current state   

Probability of trading outcomes with Proper Risk management  

We will take the most simple  Trading system (Fliping the coin )  -with proper money management rules

Our Rules
Cut your losses
And let the profit Runs

Say we have 10 trading outcomes with risk reward ratio of 1:3

Heads we win = and we gain 3 points
Tails we loose = and we lost 1 points

Now here we don't know what will be the sequence of outcome that when the head will arrive or when the tail will arrive - but our stop loss (Risk)  is define that is one point

First flip Tails = loss one point 
Second Flip Tails  = loss one point 
Third Flip Tails = Loss one point 
Fourth Flip Heads= You win 3 points 
Fifth flip Tails =You loose one point 
Sixth Flip Tails = You Win 3 points 
 Seventh Flip Heads =You win 3 points 
Eighth Flip Tails = You loose one point 
Ninth Flip heads  = You win 3 points 
Tenth flip Tails = You loose one point 

If we notice in the above trading out come our winning Ratio is only 40 %
And we have lost 60% of the time and still we are making 6 points Gain 

i.e. = 4 head profits = 4*3= 12 points
= 6 tails loss = 1*6 = 6 points
 Therefore Gain of 6 points


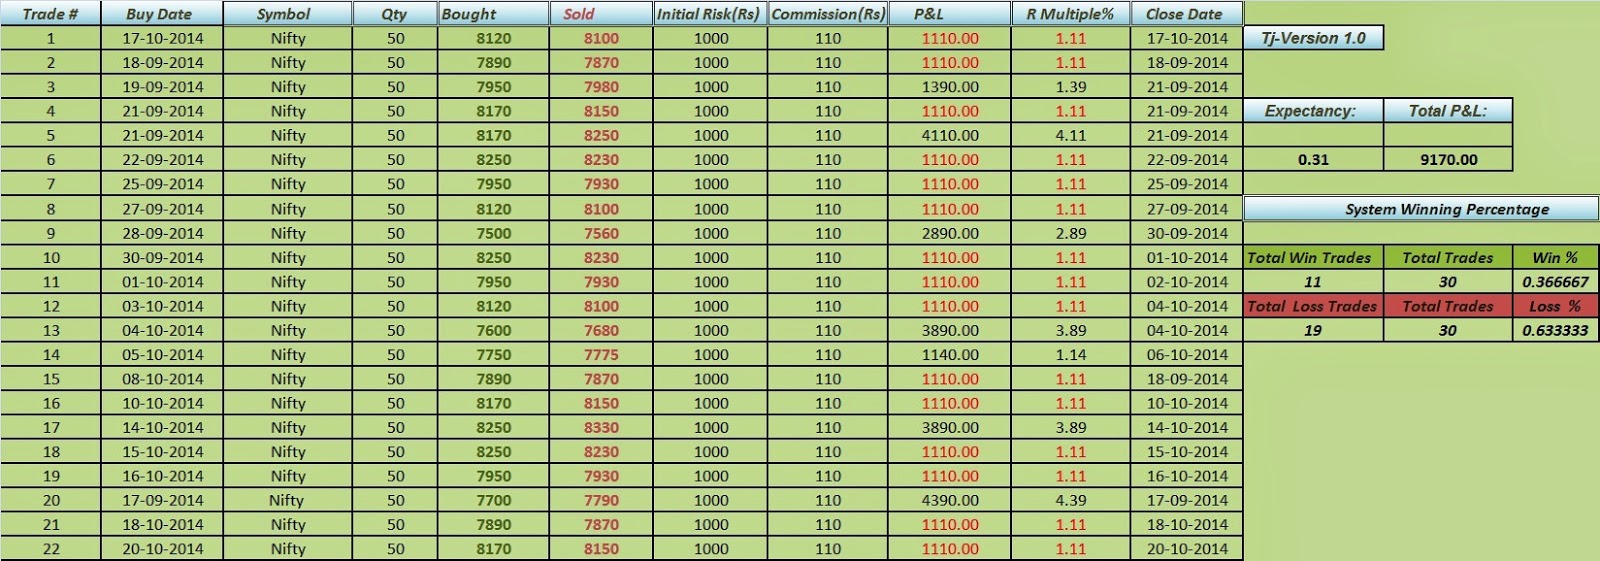
To track our trading skill i have created a Trading journal - which i fell very important for traders to maintain it on each trade - which in turn will help us to understand our skill level in long term
also i have given explanation for   R multiple % and Expectancy in the Sheet - if you want more understanding on this above concept please read the books of Van tharp


In the  trading excel sheet i have given some examples to understand the sheet and its outcome over 30 trades

If you have any further suggestions on the trading journal sheet please share - so that we can make a better trade management system


Trading Journal link
http://www.4shared.com/file/DSpXNWd-ce/tj_online.html?


A Nice video on Trading Psychology
https://www.youtube.com/watch?v=lNrFx3vnjWo

Wednesday 3 September 2014


What are our Trading outcomes ?
  • Break even
  • Small loss 
  • Large profit 
  • Small profit 
Never :- LARGE LOSS 

You should Never Suffer a large loss 

  • Because its harder to recover a loss than it is to make the loss 
  • It takes a higher percentage win to recover a loss  
Lets see some basic Mathematics in detail to understand 

Example one 
Loss of 50 % and win of 50 % 
In the above example when the first trade we make its a loss of 50 % and in  second we have a win of 50 % - so if we are thinking that the account will be at break even - then we are wrong because we have have draw down of 25 percent (actually its little more than that cause i have not included brokerage in it )

Example two 
Now if you think that as we have made loss first so we have lost 25 % - then lets reverse it and see the result

Win of 50 % and Loss of 50%

Now in the above example even when the first trade we make is profit of 50 % and our account size grows to 15000 in the next trade we make a loss of 50 % on 15000 and our account reduces to 7500
result is the same - A draw down  of  25 % exactly the same result

Example Three 


The fact is that if you loose 50 percent of your capital -then your require 100 % profit to recover the looses and to right back where you started   - and its lot harder to make 100 % on your 50 % draw down account

Lets See Some Percentage Required to get the account size  to break even 


  • Respect the Risk in the market 
  • Make capital preservation your number one goal 
  • learn with small accounts 
  • In cooperate money management rules in your trading system according to your risk appetite  

Position  Sizing 

What is position sizing ?

Position sizing Specifically refers to how much should i risk on each trade -that means whether i should buy 5 lots of nifty or 10 lots of nifty -how should i determine - for this we should know three things 

  • Our Account size 
  • What % of our account size we are willing to risk ( it depends upon us some traders willing to risk 1 to 3 % - some risk 5 to 10 % it totally depend upon our Risk Tolerance ) but its better to start with small percentage (also by back testing your Stock or index over a period of 10- 15 years we will come to know the maximum draw down on that Script and accordingly we can fix the Risk  Percentage 
  • Stop loss in rupees 
So the Formula for Position Sizing is 


Lets Understand  taking nifty as a Example 

Say for example our account size is 100000
Our % of Risk Tolerance is 2%
Our Stop loss is Rupee say 500 rupees  (10 points) 


So in the above case we can trade with 4 lots of nifty as 2 % risk for the trade 


Saturday 7 December 2013

SQUARING THE PRICE RANGE WITH TIME


The squaring of price and time was one of the most important and valuable discoveries that Gann ever made. In his trading course he stated “if you stick strictly to the rule, and always watch when price is squared by time, or when time and price come together, you will be able to forecast the important changes in trend with greater accuracy.”

The squaring of price with time means an equal number of points up or down, balancing an equal number of time periods- either days, weeks, or months. Gann suggested traders square the range, low prices, and high prices.


Squaring the Range

When Gann angles are drawn inside a range, the angles provide the trader with a graphical representation of the squaring of the range. For example, if a market has a range of 100 and the scale is 1 point, a Gann angle moving up from the bottom of the range at 1 point per time period will reach the top of the range in 100 time periods. A top, bottom, or change in trend is expected during the time period when this occurs. This cycle repeats as long as the market remains inside the range.


Squaring a Low

Squaring a low means an equal amount of time has passed since the low was formed. This occurs when a Gann angle moving up from a bottom reaches the time period equal to the low.

For example, if the low price is 100 and the scale is 1, then at the end of 100 time periods an uptrending Gann angle will reach the square of itself. Watch for a top, bottom, or change in trend at this point. The market will continue to square the low as long as the low holds.


A graphical representation of squaring a low price can be seen on a chart Gann called a zero-angle chart. This chart starts an uptrending angle from price 0 at the time the low occurred and brings it up at one unit per time period. When this angle reaches the original low price, a top, bottom, or change in trend is expected.

Squaring a High

Squaring a high means an equal amount of time has passed since the high was formed. This occurs when a Gann angle moving down from a top reaches the time period equal to the high. For example, if the high price is 500 and the scale is 5, then at the end of 100 time periods a downtrending Gann angle will reach the square of itself. Watch for a top, bottom, or change in trend at this point. The market will continue to square the high as long as the high holds.

A graphical representation of squaring a high price can be seen on a zero-angle chart. This chart starts an uptrending angle from price 0 at the time the high occurred and brings it up at one unit per time period. When this angle reaches the original high price, a top, bottom, or change in trend is expected.

Time analysis in Gann Theory requires the trader to study market swings, anniversary dates, cycles, and the squaring of price and time to help determine  change in trend points.


Read Michael S. Jenkins masterpiece 'Square The Range Trading System'For Complete understanding of this Method


Monday 2 December 2013

Jesse Livermore trading Style


Jesse Livermore is known to most as the best market player Wall Street has ever heard about, rivaling perhaps even Gann. Livermore is alleged to have engaged in every single biggest stock and commodities moves from 1910 – 1940. He needed to be doing something right to just have survived monetarily for three decades.
Livermore might be a very good model for today’s computer stock trader. In the Livermore era there was no tv, no computing devices, and no world wide web. Even if were able to afford to pay a staff to chart stocks and futures you would not have had 24×7 immediate access to financial data files to keep those charts up to the minute. Any profitable stock trading system that could stand up to the test of time had to use easy to get data, be clear to understand, and be simple to apply. Contemporary technical analysis tools like stochastics and the elliott wave oscillator were out of the question.
His method was based on a trend following system. Livermore only took positions in the direction of the major trend. He opened his position with a minor stake and added to it as the trend persisted in its expected direction. Jesse Livermore said “Just recognize that the movement is there and take advantage of it by steering your speculative ship along with the tide.”

In or out. Long or short. Regardless of how many gigabytes you might have for your cutting edge, computer-based trading system it all comes down to those two choices. He set objective stop loss levels and bailed out immediately from his entire position whenever a stop was touched. Livermore did not feel pressured to trade each and every single day, neither did he try to catch every jiggle in stock prices. He followed only the major, cyclical trends.

The Livermore System defines the trading ticker in terms of trend and swing. An upswing, for example, is a consecutive series of higher pivot highs and higher pivot lows. An uptrend is a consecutive series of upswings. A downswing is a consecutive series of lower pivot lows and lower pivot highs. A downtrend is a consecutive series of downswings.

Trends and swings are determined by two filters. A larger swing filter and a penetration filter that is one-half the size of the swing filter. A change in trend is a retrace of swing filter size from the last up or down swing. A pivot is the high or low point of each swing. Time is not a thing to consider in the Livermore System or in the making of a swing chart.

Livermore utilized hand drawn swing charts that looked somewhat like a point and figure chart. As a substitute for Xs and Os and box sizes, a Livermore swing chart is a vertical line drawn when prices have moved by a fixed number of points in the opposite direction from the previous high or low pivot.

Livermore utilized penetrations of the pivot points to either add new positions when they occurred in the direction of the trend, or as stop-loss levels when they occurred in a direction opposite to the trend. The Livermore System is somewhat unique because of the role of the penetration filter. Many other swing trading systems use any breakout of a prior pivot high pivot or low pivot as the signal to add positions or as a stop loss level.
All positions were liquidated at the first penetration of a stop-loss level. A second penetration of the next occurring pivot in the direction of the new trend confirmed the new trend. A new trend “failed” when the second confirmation did not occur. In those cases Livermore would reenter in the direction of the prior trend when prices exceeded the size of the swing filter from the failed trend’s highest high or lowest low

Wednesday 13 November 2013

Look at the Below Picture What you See a Floor or a Ceiling - Optical Illusion is also called a Visual illusion is characterized by Visually Perceived images that differ  from objective reality. The Information Gathered by the Eye is process in the Brain to give a perception that does not tally with the physical measurement of the Stimulus Source  

The Same Illusions Are created in the Price By the Market Makers or Market Manipulators - So to understand this first we should understand How our Human Brain is Functions and what are its Limitation - 
Our Human Brain First Collect the Facts and Figures and then its is Processed for analysis - this is how we make the decisions - now the second thing we should understand is that this human brain has some limitations -and everything in this world has its limitation - their is no such things which are unlimited 

IF we take the Example of our Ears it has also some limitation - we can hear the Sound to a particular level of Frequency beyond that frequency if we hear  it will damage our ears - Even our Body has limitation of body temperature- Below 96 degree we will die and above 110 degree we will die - so the limitation of our body temperature is 14 degree -so below or above that temperature our body does not cope with that temperature - 


 Now if we speak about the Human brain it has also some limitation - and in trading it is the only thing which we use so to understand trading or investing first we should understand its function and how it works - so that we can increase our efficiency as a trader or investor  


When we make the Decision we make the Decision Consciously - while making decision consciously our Pre frontal cortex is working this function is activated and helps us to take the decision  - Say for Example you have decided to buy Nifty - Here your Pre frontal Cortex Function is activated 
The Second Function is Sensory Precortex and this part is activated when our focus is Diverted for example if you consciously decide through Your trading system  that you are going to buy nifty  and technically you are convinced that its a good buy Signal - Now here the market Divert your Focus By Volatility by make sharp movements like 100 Points down 50 points up then again 50 Points  down - 40 points up - Now your Focus is Diverted by the Market Through Volatility and your afraid to execute your Buy Position   - Because your focus is diverted 

So as a Trader or investor we should work on The secondary Function that is Sensory Pre cortex and we cannot control the market volatility  but we can work on our selves to improve our decision making process 

Say for Example - You are learning to drive the Bike For the First time in your Life - Here your First Fuction is activated that is Pre frontal cortex - You are very Conscious about your Surroundings and then your secondary function will be activated that is sensory  pre cortex where your   focus will be diverted by traffic - by people - by sound  - and number of things and you will fall couple of times and you will get hurt -  but in this process a time will come where you will learn to ride the bike and balance it effortlessly and this balancing process cannot be thought you have to learn it by yourself and then your brain is set to auto drive - and it will not get distracted or diverted by the traffic or any sound - 


So in stock market to set our brain on auto drive we have to tie ourselves with a trading system which suits our personality - and have to improve it in the process - you will not get the perfect system  initially its an on going process and thus by following a system you will avoid unnecessary noise which are created by market 


Watch this video 


Sunday 20 October 2013

The Secret Language Of Market


We Cannot Understand the Stock Market ,if we do not first learn the language and Grasp the Symbol in which it is written -Market is Written in Mathematical Language and its  Symbols  are   Geometrical Patterns - Without this it is Impossible to Comprehend a single word of it and the persons who gains this understanding and wisdom  is more Profitable - This Harmony is expressed by some key Fibonacci Numbers - Each Individual Stock or Commodity Have its Harmony Numbers - Which you will Discover If you Study the Patterns and charts of last 10 -15 years


Watch Marko Rodins Video on Youtube and just try to understand what he is saying .Basically he is found the Math to the real 'God Particle or Particle of Spirit - Known as Brahman in the vedas ,and he has shown -how it can be observed - but not with the Physical Instruments .Thus Mathematics is in fact Surest proof of cosmic mind and Intelligence - If Mathematics is the language of the Market and the Nature - & rather acting on common sense opinion and emotional decision where most Trader get Screwed - That's what happens in the Stock market -Traders make their Decision On Emotion Rather base on  Pure Mathematical Approach   


Ed Seykota the all time great Trend Following Trader Declared that the biggest Secret about success in trading is that there is not any big Secret about it - The more complicated and sophisticated   inidicators you develop it will became more harder to follow it and make money from that indicator -The most Robust Strategies in the Markets are the Simplest Strategies - Which are Base on Simple Mathematics - So in Short Complicated Trading Systems Cant be Profitable in the Long Run - So develop a trading Plan which is More Compatible with your own Nature of trading -because we understand ourselves more better then any other person - So build System According to your Nature and Behavior  and once you Develop the Trading System - Then the Key to Long term Survival and Prosperity has a lot to do with the money management techniques which should be incorporated into Your Trading System 


Saturday 12 October 2013

What is a Gann Emblem ?

What is a Gann Emblem ?

Gann Emblem is basically a Forecasting Tool Which Forecast the Future Reversal dates .Gann Said Within a Circle is a square and a Triangle and this aspects are related to Astrology , Where we take Solar Degrees Into Consideration - But as in astrology Specific Zodiac Signs Are Related to individual person ( What we Called the Ruling Planet of the Individual ) - same laws Apply in stock market - For each Specific Stock ,Index or Commodity  they have their Individual Ruling Planet and Zodiac Signs


How do we find our Ruling Planet and Zodiac Signs ?

Base on Our time of Birth and than Longitude and  Latitude same things Apply for Stocks , Index For Example NIfty Was Born on Monday 7 Nov 1994   if i am not wrong ,Whereas
To find Out the Longitude and Latitude we have to take NSE location into consideration
So by taking this things into account we can Find the Ruling Planet and Zodiac Sign Of Nifty
And If u notice the All time High in Nifty Spot was made on 5 November 2010 and it was Friday - So the cycle has completed 2 Days Before - Because 7 Nov was a Sunday .

To Use Gann Emblem Forecasting Technique to its Potential  it is  Mandatory To Know The Financial Astrology  - Which is a whole new Topic in Itself -  and it will take Years to Master .So Just i have Given a Glimpse of What is Gann Emblem Basically .